Auto Amazon Links: No products found. Blocked by captcha.
Encountering cryptic Python exit errors can be frustrating for developers. But learning to properly debug these errors is a key troubleshooting skill for Python programmers.
This comprehensive guide explores common Python exit errors like SystemExit, KeyboardInterrupt, and fatal Python errors. It provides actionable techniques to diagnose the root causes of exit errors and fixes to resolve issues in your Python programs.
Debugging exit errors ultimately leads to more resilient Python code and more productive debugging sessions.
Overview of Python Exit Errors
- Exit errors in Python immediately terminate the program or script.
- Common exit errors include SystemExit, KeyboardInterrupt, import errors, indentation errors, and fatal Python errors.
- Exit errors surface from improper program logic, bugs, environment issues, or user interrupts.
- Debugging involves tracing errors to their source through stack traces, print statements, logs, assertions, and more.
- Learning to pinpoint and resolve exit errors results in more robust Python code.
Key Causes of Python Exit Errors
Several issues commonly trigger Python to abruptly exit with errors:
- Import failures: Missing modules, packages, or import dependencies cause the program to halt.
- Code exceptions: Bugs in program logic raise unhandled exceptions that crash Python.
- User interrupt: The user triggers a KeyboardInterrupt by pressing Ctrl+C.
- SystemExit exception: Code directly calls sys.exit() to intentionally exit early.
- Fatal Python errors: Severe interpreter-level errors terminate Python immediately.
- Syntax errors: Improper Python syntax like missing colons cause parsing failures.
- Indentation errors: Inconsistent indentation generates errors and early termination.
- Environment issues: Insufficient permissions, full disks, or hardware failures.
Gaining familiarity with these potential sources of exit errors will help focus debugging efforts.
Debugging a Python SystemExit Error
The SystemExit error surfaces when Python code directly calls sys.exit(). This immediately terminates the program.
For example:
import sys

sys.exit(1)This raises SystemExit and quits Python.
Debugging involves:
- Checking for explicit sys.exit() calls in your code. Ensure exit calls aren’t accidentally triggered.
- Setting a breakpoint on sys.exit. Then examine the call stack to spot the origin.
- Wrapping suspicious exit calls in try/except blocks to handle them gracefully.
-Tracing the propagation of return codes that lead to exit calls.
- For libraries and integrations, loggingintentional sys.exit reasons for auditing.
With this approach, you can methodically find the source of SystemExit exceptions and control program termination more granularly.
Debugging a Python KeyboardInterrupt
The KeyboardInterrupt error occurs when a Python program is forcibly quit by the user pressing Ctrl+C.
For example:
while True:
passThis infinite loop would be interrupted with KeyboardInterrupt on Ctrl+C.
To debug KeyboardInterrupt errors:
- Set breakpoints on signal handlers for SIGINT events triggered by Ctrl+C.
- Check for and minimize blocking calls that delay response to interrupt signals.
- Structure programs to poll for interrupts during long-running operations.
- Create custom signal handlers with
signal.signal()to handle Ctrl+C gracefully. - Detect when user input is coming from a terminal to selectively handle signals.
With proper handling, Python can detect Ctrl+C interrupts and avoid abrupt termination.
Debugging Fatal Python Errors
Fatal errors arise from severe interpreter-level issues that prevent Python from continuing. For example:
Fatal Python error: Py_Initialize: Unable to get the locale encoding
ImportError: No module named 'encodings'Fatal errors shooting down Python itself must be debugged at the environment level:
- Inspect the full error output for clues on missing dependencies.
- Review recent changes to the Python installation and environment.
- Ensure core packages like encodings are installed and imports succeed.
- Check the Python version and path – conflicts can cause issues.
- Try reproducing in a fresh virtual environment to isolate the cause.
- Search Python’s bug tracker for similar fatal errors.
With diligence, the root cause of fatal Python crashes can be determined through environmental debugging.
Debugging Python Import Errors
Import errors arise when the Python interpreter fails to load modules or packages:
import maths

# ModuleNotFoundError: No module named 'maths'Here the module name is misspelled, causing failure.
To debug import issues:
- Inspect the exact missing module or package. Install it if missing.
- Check for typos in import statements versus installed library names.
- Verify the PYTHONPATH and environment is configured correctly.
- Make sure imported files are in expected directories and have valid Python syntax.
- Handle import errors in try/except blocks and print debugging info.
- Review recent changes around installed packages and imports.
Methodically tracking down the source of the failed import enables it to be corrected.
Debugging Python Indentation Errors
The dreaded IndentationError arises when indentation is inconsistent:
def foo():
print("hi")
# IndentationError: unexpected indentThe function body is indented further than the def statement, triggering syntax errors.
To eliminate indentation bugs:
- Use a linter/formatter like black or yapf to auto-fix indentation issues.
- Configure your editor to show whitespace and indentation markers.
- Avoid mixing tabs and spaces. Set the editor to expand tabs to spaces.
- Perform a project-wide find/replace to standardize old indentation.
- Refactor complex nested code with inconsistent indentation to be clearer.
- Review diffs carefully when indentation has changed.
With discipline, indentation errors can be banished entirely from Python projects.
Leveraging Stack Traces to Debug Exit Errors
When Python encounters errors, it provides a full stack trace showing the active call sequence:
Traceback (most recent call last):
  File "script.py", line 2, in <module>
    import maths
ModuleNotFoundError: No module named 'maths'The stack trace indicates the import error occurred in script.py on line 2.
Key stack trace debugging practices:
- Inspect the stack frames to discover the sequence of function calls.
- Pinpoint the earliest frame related to your code rather than internal calls.
- The first frame is often the source of the issueversus downstream consequences.
- Check parameters and variables in each frame for bad values.
- Analyze the code location surfaced for possible causes.
- Search frame excerpts for unique strings to locate bugs.
Stack traces provide a vital breadcrumb trail back to an error’s origin.
Using Print Debugging to Understand Flow
Strategically inserting print statements can reveal runtime control flow:
print("Reached start")

print("Calling open_file()")
open_file()

print("Opened file")

print("Calling process_data()")
process_data()

print("Finished")Now the sequence of steps becomes clear from the debug output.
Effective print debugging techniques:
- Print entering and exiting key functions to trace execution flow.
- Use descriptive strings beyond bare
print(var)to provide context. - Print types, values, and representations of suspicious variables.
- Temporarily print before and after every line to pinpoint crashes.
- Format prints to include time, log level, and other metadata.
Print debugging provides a lightweight but effective way to understand complex code flow.
Logging Errors and Debug Data
Robust logging of errors and diagnostics provides long-term debuggability:
import logging

logger = logging.getLogger(__name__)

...

try:
   open('/tmp/file.txt')
except OSError as e:
logger.error("Opening file failed", exc_info=e)Now the exception is logged with full traceback for subsequent analysis.
To leverage logging for debuggability:
- Log exceptions along with descriptive context at error severity.
- Track executed code paths, inputs, and key data as debug logs.
- Custom exception classes can provide hooks to log state on errors.
- Standardize log formats across modules and integrate with monitoring.
- Configure logging verbosity, rotation, and destination appropriate for debugging needs.
Thorough logging practices transform errors into actionable insights.
Tracing Code Execution with Debuggers
Python debuggers like pdb allow stepping through code:
import pdb; pdb.set_trace()

x = 5
y = 10

# Execution pauses here in debugger
z = x + yDebuggers are extremely useful for interactively analyzing running programs:
- Halt execution and inspect stack frames and objects.
- Step through code line-by-line to closely follow execution flow.
- Evaluate variables and expressions in the current context.
- Try out modifications without restarting.
- Integrated IDE debuggers add visual tools like watch variables.
- Leverage built-in breakpoint() function for quick debugging.
Debuggers enable rapid, iterative debugging within a live program context.
Trapping Bugs with Assertions
Assertions validate program assumptions:
nums = [1, 2]
assert len(nums) == 2, "Invalid length"

nums.pop()
assert len(nums) == 1, "Length should be 1 after pop"If assertions fail, they raise informative exceptions:
AssertionError: Length should be 1 after popEffective assertion strategies:
- Assert critical truths like input shapes, data invariants, and limits.
- Raise specific, helpful errors when assertions fail.
- Use assertion helper functions or classes to standardize validation.
- Avoid side effects inside assertions.
- Enable assertion checking only during testing for performance.
Assertive programming surfaces hidden bugs early and document assumptions.
Using Interactive Debuggers and REPLs
REPLs like IPython provide an interactive environment ideal for debugging:
In [1]: x = 5

In [2]: y = 10

In [3]: x + y
Out[3]: 15The interactive prompt allows inspecting and manipulating variables on the fly.
Key REPL debugging features:
- Explore and experiment on values after exceptions arise.
- Avoid restarting programs to rapidly test fixes.
- Interactive completion helps findproblematic variable names.
- Easily re-run error-triggering snippets.
- Integrates debugging commands like pdb.
REPLs enable fast, iterative debugging workflows.
Leveraging Issue Trackers and Documentation
Thorough issue tracking helps identify systematic errors:
- Link stack traces and bug details to tickets in the issue tracker.
- Cross-reference related issues and track root cause analysis.
- Tag, prioritize, and schedule issues collaboratively.
- Document error details, reproduction steps, and attempted fixes during triage.
- Leverage issue history to spot recurring errors.
Robust documentation is also key:
- Note workaroundslike invalid inputs that trigger crashes.
- Formally specify expected program behavior.
- Add how-to debugging guides to project wikis with techniques to investigate issues.
Effective documentation and issue hygiene reinforces institutional debugging knowledge.
Adopting a Methodical Debugging Mindset
Some key principles for effective debugging include:
- Reproduce errors reliably: Use documentation and scripts to recreate issues.
- Understand normal behavior: Establish expected baselines before debugging weirdness.
- Make incremental changes: Change one variable at a time when experimenting.
- Consider potential causes: Brainstorm sensible theories for investigation.
- Divide problems into parts: Break down big errors into smaller errors to solve.
- Question assumptions: Double-check even “obvious” truths that could be wrong.
A scientific, methodical debugging mentality avoids random guessing and reaches the true root cause faster.
Common Debugging Pitfalls to Avoid
Some debugging anti-patterns to be aware of include:
- Focusing on downstream effects: The first error is often a consequence, not the cause itself.
- Changing multiple variables: Makes it hard to isolate the specific change that fixed things.
- Guessing randomly: Have a systematic error triage process rather than guessing.
- Ignoring warnings: Fix warnings now rather than allowing them to become errors later.
- Overlooking documentation: Issue trackers, wikis, and FAQs provide clues.
- Thrashing: Frantically changing code without a clear direction wastes time.
Avoiding these debugging pitfalls will help identify the true underlying error cause faster.
Key Factors for Debugging in a Production Environment
Special considerations apply when debugging issues in production:
- Monitor crashes in production and trigger alerts.
- Log debug data but avoid exposing sensitive customer information.
- Script reproducibility of errors to reliably recreate them in staging environments.
- When possible, use canary/dark launches to test bug fixes on a subset of traffic.
- Leverage tracing systems like Zipkin to follow the lifecycle of failed requests across services.
- For customer-reported issues, collect detailed but anonymous logs and events leading up to errors.
- Test and stage bug fix rollouts thoroughly before promoting fully into production.
Debugging practices must strike a balance between resolving issues and minimizing production disruption.
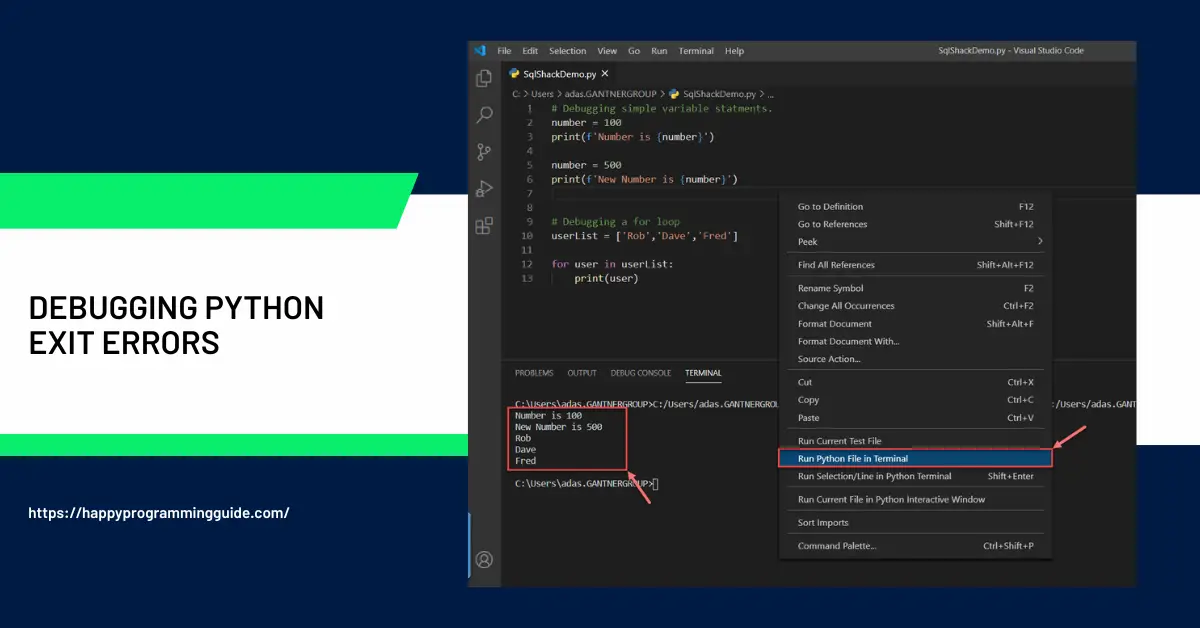
Debugging Python Exit Errors in IDEs
Modern IDEs like PyCharm provide user-friendly graphical debugging:
[Image: PyCharm debugging screenshot]Integrated debuggers improve visibility into program state with features like:
- Clickable stack frames linking directly to source code.
- GUI variable explorers to inspect data.
- Live debugging as code runs with breakpoints.
- Memory use and CPU utilization metrics.
- Debugger-aware editors with syntax highlighting.
- Integration with interpreters like IPython.
Leveraging IDE debugging capabilities accelerates identifying and fixing errors.
Debugging Strategies to Learn
Some key debugging skills for Python developers include:
- Reproducing errors: Reliably recreating bugs provides a foundation for investigation.
- Tracing execution flow: Follow the code path leading up to an error.
- Isolating causes: Change one variable at a time to pinpoint the specific trigger.
- Reducing complexity: Break code into simpler components until the error disappears.
- Questioning assumptions: Double-check taken-for-granted beliefs that may be incorrect.
- Seeking alternate perspectives: Get fresh insight into assumptions from teammates.
Building these habits will help unravel the most obscure Python bugs.
Common Python Exceptions
Some frequent built-in Python exception types include:
- ImportError: Failure importing a module, package, or name.
- IndexError: Sequence index out of range.
- NameError: Undefined variable referenced.
- ValueError: Argument has invalid value.
- TypeError: Operation on wrong type object.
- AssertionError: check built-in assertions fail.
- KeyboardInterrupt: User pressed Ctrl+C.
- OSError: System I/O operation failure.
- SyntaxError: Code fails to parse.
Learn common exceptions to better understand the root causes indicated by tracebacks.
Key Debugging Tools for Python
Useful Python debugging tools include:
- Print statements: Quick debugging with temporary print output.
- Logging: Robust logging of debug data and errors.
- PDB: Built-in Python debugger for stepping through code.
- IDEs: PyCharm and VS Code provide user-friendly debugging GUIs.
- REPLs: Interactive shells like IPython enable experimentation.
- Profilers: Tools like pyinstrument find performance issues.
- Static analysis: Linters like flake8 and pylint surface bugs.
Leveraging the rich Python tooling ecosystem accelerates debugging.
Platform-Specific Debugging Techniques
Certain debugging techniques apply on specific platforms:
- Linux/Unix: Leverage debuggers like gdb to analyze core dumps and process state.
- Docker: Executive into containers and reproduce locally for debugging.
- Kubernetes: Access pod logs and metrics for debugging distributed services.
- AWS Lambda: Inspect logs and traces to debug serverless functions.
- Mobile: Debug on emulators and devices to catch issues specific to mobile platforms.
Factor the platform and environment into debugging workflows.
Fostering a Debugging-Focused Engineering Culture
Organizations should encourage debugging best practices:
- Allocate debugging time: Provide time for reproducing and investigating failures, don’t incentivize quick hacky fixes.
- Start with fundamentals: Ensure developers have training in core debugging tools and techniques.
- Enable experimentation: Allow time for iterative debugging and troubleshooting.
- Standardize with docs: Create wiki pages capturing solutions to common errors.
- Debug in pairs: Encourage joint debugging for exposure to different techniques.
- Postmortem effectively: Blameless analysis of major outages yields insights.
Prioritizing disciplined debugging creates more sustainable code quality and velocity.
FAQs
-
How do I prevent a
SystemExiterror from terminating my script?
To prevent a SystemExit error from terminating your script prematurely, you can encapsulate your code in a try…except block, catching the SystemExit exception. This way, you can handle the error gracefully and take necessary actions before exiting.
-
Can a
ZeroDivisionErrorbe avoided?
Yes, a ZeroDivisionError can be avoided by implementing conditional checks to ensure you’re not dividing by zero. For instance, you can add an if statement to verify the divisor is non-zero before performing the division.
-
Why do I get a
NameErroreven when the variable is defined?
A NameError occurs when Python doesn’t recognize a variable because it’s not defined in the current scope. Check the variable’s scope and make sure it’s accessible where it’s being used.
-
Is it possible to recover unsaved changes after an unexpected exit?
Unfortunately, recovering unsaved changes after an unexpected exit is challenging. It highlights the importance of saving your work regularly during development.
-
How can I debug exit errors in large codebases?
For debugging exit errors in large codebases, start by isolating the problematic section. Temporarily remove or comment out segments of code to narrow down the source of the error. Gradually reintroduce code while monitoring for the exit error.
-
What should I do if an exit error persists despite trying various solutions?
If an exit error persists, consider seeking help from online programming communities or forums. Experienced developers might provide fresh insights and solutions to your specific issue.
Auto Amazon Links: No products found. Blocked by captcha.